As a DBA, being able to quickly locate and track problematic queries is invaluable. I will share some queries that I have collected from various sources or created that has assisted in the troubleshooting process when trying to identify problematic queries. As time goes on, I will update this posts with additional content as new methods of investigation are found.
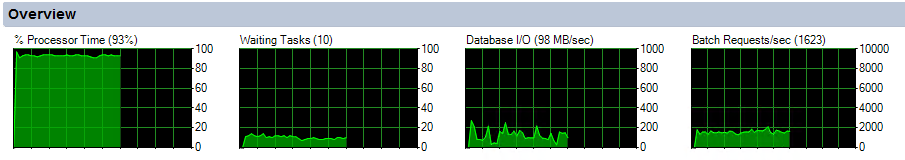
You log in a SQL Server that is reporting that there are issues found and you open Activity Monitor to get a good idea of what is going on and you see the following:

Where do you start? What do you look into first? Below is some sample issues reported and the queries that I would use to start the troubleshooting process.
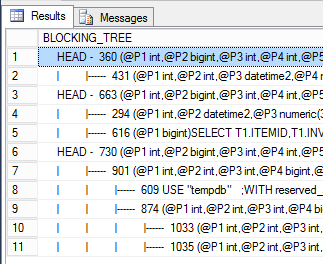
Problem 1: Queries are being blocked and you would like to identify the head blocker.
There are two queries that I use to identify the head blocker, the first is more consistent in it's results but the second also includes a bit more information.
Query 1: Provides the SPID and the query text
SET NOCOUNT ON
GO
SELECT SPID, BLOCKED, REPLACE (REPLACE (T.TEXT, CHAR(10), ' '), CHAR (13), ' ' ) AS BATCH
INTO #T
FROM sys.sysprocesses R CROSS APPLY sys.dm_exec_sql_text(R.SQL_HANDLE) T
GO
WITH BLOCKERS (SPID, BLOCKED, LEVEL, BATCH)
AS
(
SELECT SPID,
BLOCKED,
CAST (REPLICATE ('0', 4-LEN (CAST (SPID AS VARCHAR))) + CAST (SPID AS VARCHAR) AS VARCHAR (1000)) AS LEVEL,
BATCH FROM #T R
WHERE (BLOCKED = 0 OR BLOCKED = SPID)
AND EXISTS (SELECT * FROM #T R2 WHERE R2.BLOCKED = R.SPID AND R2.BLOCKED <> R2.SPID)
UNION ALL
SELECT R.SPID,
R.BLOCKED,
CAST (BLOCKERS.LEVEL + RIGHT (CAST ((1000 + R.SPID) AS VARCHAR (100)), 4) AS VARCHAR (1000)) AS LEVEL,
R.BATCH FROM #T AS R
INNER JOIN BLOCKERS ON R.BLOCKED = BLOCKERS.SPID WHERE R.BLOCKED > 0 AND R.BLOCKED <> R.SPID
)
SELECT N'    ' + REPLICATE (N'|         ', LEN (LEVEL)/4 - 1) +
CASE WHEN (LEN(LEVEL)/4 - 1) = 0
THEN 'HEAD -  '
ELSE '|------  ' END
+ CAST (SPID AS NVARCHAR (10)) + N' ' + BATCH AS BLOCKING_TREE
FROM BLOCKERS ORDER BY LEVEL ASC
GO
DROP TABLE #T
GO
Query 2: Provides a bit more information but is not as constant with locating head blockers.
SELECT
db.name DBName,
tl.request_session_id,
wt.blocking_session_id,
OBJECT_NAME(p.OBJECT_ID) BlockedObjectName,
tl.resource_type,
h1.TEXT AS RequestingText,
h2.TEXT AS BlockingTest,
tl.request_mode
FROM sys.dm_tran_locks AS tl
INNER JOIN sys.databases db ON db.database_id = tl.resource_database_id
INNER JOIN sys.dm_os_waiting_tasks AS wt ON tl.lock_owner_address = wt.resource_address
INNER JOIN sys.partitions AS p ON p.hobt_id = tl.resource_associated_entity_id
INNER JOIN sys.dm_exec_connections ec1 ON ec1.session_id = tl.request_session_id
INNER JOIN sys.dm_exec_connections ec2 ON ec2.session_id = wt.blocking_session_id
CROSS APPLY sys.dm_exec_sql_text(ec1.most_recent_sql_handle) AS h1
CROSS APPLY sys.dm_exec_sql_text(ec2.most_recent_sql_handle) AS h2
GO

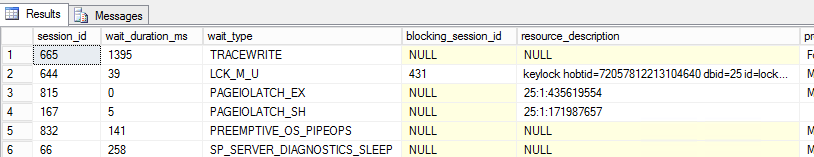
Once you have a bit more information about the head blocker, you can start exploring more options and more query information with the SPID provided.
Query 3: List all current waiting tasks with blocking session ID
SELECT w.session_id
     , w.wait_duration_ms
     , w.wait_type
     , w.blocking_session_id
     , w.resource_description
     , s.program_name
     , t.text
     , t.dbid
     , s.cpu_time
     , s.memory_usage
 FROM sys.dm_os_waiting_tasks as w
      INNER JOIN sys.dm_exec_sessions as s
         ON w.session_id = s.session_id
      INNER JOIN sys.dm_exec_requests as r
         ON s.session_id = r.session_id
      OUTER APPLY sys.dm_exec_sql_text (r.sql_handle) as t
  WHERE s.is_user_process = 1;
Problem 2: High CPU Usage
You log into the SQL Server and you see that CPU is being hit hard and you want to quickly determine what are the problem here are some quick queries that can be run to pull out the heavy hitting CPU usage queries.
Query 1: Top 10 queries consuming high CPU currently running
SELECT TOP 10 s.session_id,
	r.status,
	r.blocking_session_id 'Blk by',
	r.wait_type,
	wait_resource,
	r.wait_time / (1000 * 60) 'Wait M',
	r.cpu_time,
	r.logical_reads,
	r.reads,
	r.writes,
	r.total_elapsed_time / (1000 * 60) 'Elaps M',
	Substring(st.TEXT,(r.statement_start_offset / 2) + 1,
	((CASE r.statement_end_offset
		WHEN -1
		THEN Datalength(st.TEXT)
		ELSE r.statement_end_offset
		END - r.statement_start_offset) / 2) + 1) AS statement_text,
	Coalesce(Quotename(Db_name(st.dbid)) + N'.' + Quotename(Object_schema_name(st.objectid, st.dbid)) + N'.' +
	Quotename(Object_name(st.objectid, st.dbid)), '') AS command_text,
	r.command,
	s.login_name,
	s.host_name,
	s.program_name,
	s.last_request_end_time,
	s.login_time,
	r.open_transaction_count
FROM sys.dm_exec_sessions AS s
JOIN sys.dm_exec_requests AS r
ON r.session_id = s.session_id
CROSS APPLY sys.Dm_exec_sql_text(r.sql_handle) AS st
WHERE r.session_id != @@SPID
ORDER BY r.cpu_time desc
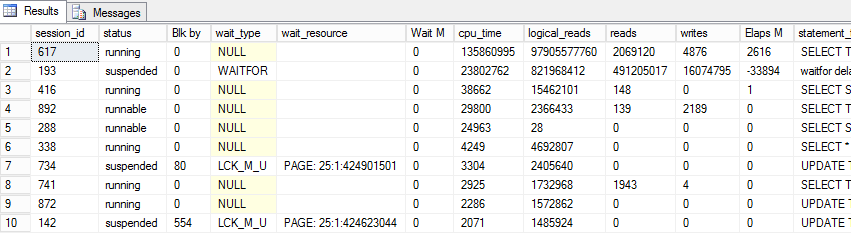
This will give you a list of the top 10 currently running heavy hitting CPU queries. Usually this is enough to give me a good idea at where to start looking for more details.
The next query I will use after I log into a system and the symptoms of the problem have already subsided. This query is intensive and so running it while there is an issue on-going, will only make the problem worse.
Query 2: Top 50 CPU Intensive Queries logged in the data management view dm_exec_query_stats
SELECT TOP 50
	[Avg. MultiCore/CPU time(sec)] = qs.total_worker_time / 1000000 / qs.execution_count,
	[Total MultiCore/CPU time(sec)] = qs.total_worker_time / 1000000,
	[Avg. Elapsed Time(sec)] = qs.total_elapsed_time / 1000000 / qs.execution_count,
	[Total Elapsed Time(sec)] = qs.total_elapsed_time / 1000000,
	qs.execution_count,
	[Avg. I/O] = (total_logical_reads + total_logical_writes) / qs.execution_count,
	[Total I/O] = total_logical_reads + total_logical_writes,
	Query = SUBSTRING(qt.[text], (qs.statement_start_offset / 2) + 1,
		(
			(
				CASE qs.statement_end_offset
					WHEN -1 THEN DATALENGTH(qt.[text])
					ELSE qs.statement_end_offset
				END - qs.statement_start_offset
			) / 2
		) + 1
	),
	Batch = qt.[text],
	[DB] = DB_NAME(qt.[dbid]),
	qs.last_execution_time
FROM sys.dm_exec_query_stats AS qs
CROSS APPLY sys.dm_exec_sql_text(qs.[sql_handle]) AS qt
where qs.execution_count > 5	--more than 5 occurences
ORDER BY [Total MultiCore/CPU time(sec)] DESC
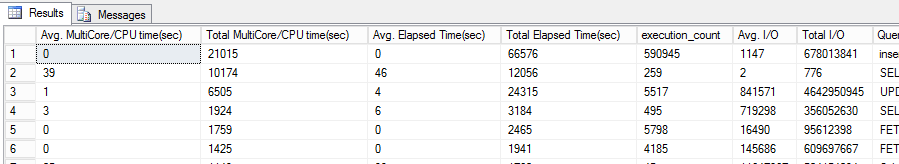
The top 10 and top 50 queries can also be used to list different resource issues by changing what they are ordered by. For example to change the top 50 query to order by the most IO used you would change the last line to:
ORDER BY [Total I/O] DESC
Problem 3: High ram usage or very low Page Life Expectancy
I haven't run into this issue very many times, usually when the Page Life Expectancy is very low and items are continually being pushed out of memory, it is a resource issue that can be fixed by lowering the data footprint of larger tables or adding more resources to the server to accommodate data growth. There will be time however you would like to have a better understanding as to what tables are the biggest ram hogs currently. The following queries can assist in troubleshooting:
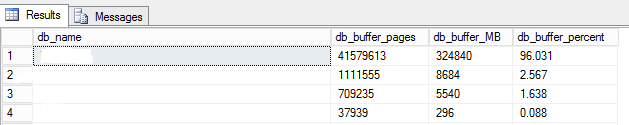
Query 1: List Database Memory Usage
DECLARE @total_buffer INT;

SELECT @total_buffer = cntr_value
FROM sys.dm_os_performance_counters
WHERE RTRIM([object_name]) LIKE '%Buffer Manager'
    AND counter_name = 'Database Pages';

;WITH src AS
(
    SELECT
        database_id
        ,db_buffer_pages = COUNT_BIG(*)
    FROM sys.dm_os_buffer_descriptors
    --WHERE database_id BETWEEN 5 AND 32766
    GROUP BY database_id
)
SELECT
    [db_name] = CASE [database_id] WHEN 32767
        THEN 'Resource DB'
    ELSE DB_NAME([database_id]) END,
    db_buffer_pages,
    db_buffer_MB = db_buffer_pages / 128,
    db_buffer_percent = CONVERT(DECIMAL(6,3),
    db_buffer_pages * 100.0 / @total_buffer)
FROM src
ORDER BY db_buffer_MB DESC;
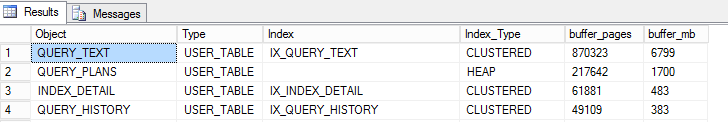
Query 2: List Table Memory Usage when run against a specific Database
;WITH src AS
(
    SELECT
        [Object] = o.name,
        [Type] = o.type_desc,
        [Index] = COALESCE(i.name, ''),
        [Index_Type] = i.type_desc,
        p.[object_id],
        p.index_id,
        au.allocation_unit_id
    FROM
    sys.partitions AS p
    INNER JOIN
    sys.allocation_units AS au
    ON p.hobt_id = au.container_id
    INNER JOIN
    sys.objects AS o
    ON p.[object_id] = o.[object_id]
    INNER JOIN
    sys.indexes AS i
    ON o.[object_id] = i.[object_id]
    AND p.index_id = i.index_id
    WHERE
    au.[type] IN (1,2,3)
    AND o.is_ms_shipped = 0
)
SELECT
    src.[Object],
    src.[Type],
    src.[Index],
    src.Index_Type,
    buffer_pages = COUNT_BIG(b.page_id),
    buffer_mb = COUNT_BIG(b.page_id) / 128
FROM
src
INNER JOIN
sys.dm_os_buffer_descriptors AS b
ON src.allocation_unit_id = b.allocation_unit_id
WHERE
b.database_id = DB_ID()
GROUP BY
    src.[Object],
    src.[Type],
    src.[Index],
    src.Index_Type
ORDER BY
buffer_pages DESC;
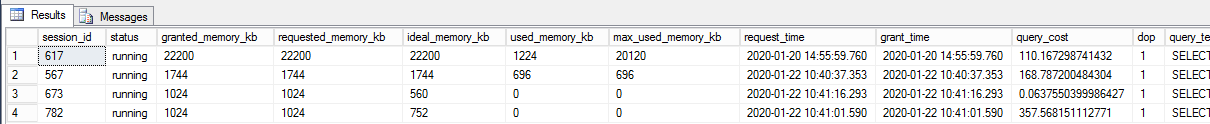
Query 3: Active Queries with current Memory Grants
SELECT r.session_id
        ,r.status
    ,mg.granted_memory_kb
    ,mg.requested_memory_kb
    ,mg.ideal_memory_kb
        ,mg.used_memory_kb
        ,mg.max_used_memory_kb
    ,mg.request_time
    ,mg.grant_time
    ,mg.query_cost
    ,mg.dop
    ,(
        SELECT SUBSTRING(TEXT, statement_start_offset / 2 + 1, (
                    CASE
                        WHEN statement_end_offset = - 1
                            THEN LEN(CONVERT(NVARCHAR(MAX), TEXT)) * 2
                        ELSE statement_end_offset
                        END - statement_start_offset
                    ) / 2)
        FROM sys.dm_exec_sql_text(r.sql_handle)
        ) AS query_text
    ,qp.query_plan
FROM sys.dm_exec_query_memory_grants AS mg
INNER JOIN sys.dm_exec_requests r ON mg.session_id = r.session_id
CROSS APPLY sys.dm_exec_query_plan(r.plan_handle) AS qp
ORDER BY mg.required_memory_kb DESC;
This should point you in the right direction on the tables/queries that are currently consuming large amounts of memory. Typically when troubleshooting performance issues, there are not many time when I have to investigate RAM usage but there have been a few times.
Problem 4: There is an active session to the database that is taking longer than expected to return data
Long running queries is the most investigated issue and there are a few queries that can be used to quickly identify those queries as well as letting you know what they are currently process or waiting on.
Query 1: Current Long Running Queries
SELECT
   r.session_id
,   r.start_time
,   TotalElapsedTime_ms = r.total_elapsed_time
,   r.[status]
,   r.command
,   DatabaseName = DB_Name(r.database_id)
,   r.wait_type
,   r.last_wait_type
,   r.wait_resource
,   r.cpu_time
,   r.reads
,   r.writes
,   r.logical_reads
,   t.[text] AS [executing batch]
,   SUBSTRING(
            t.[text], r.statement_start_offset / 2,
            (   CASE WHEN r.statement_end_offset = -1 THEN DATALENGTH (t.[text])
                   ELSE r.statement_end_offset
               END - r.statement_start_offset ) / 2
          ) AS [executing statement]
,   p.query_plan
FROM
   sys.dm_exec_requests r
CROSS APPLY
   sys.dm_exec_sql_text(r.sql_handle) AS t
CROSS APPLY
   sys.dm_exec_query_plan(r.plan_handle) AS p
ORDER BY
   r.total_elapsed_time DESC;
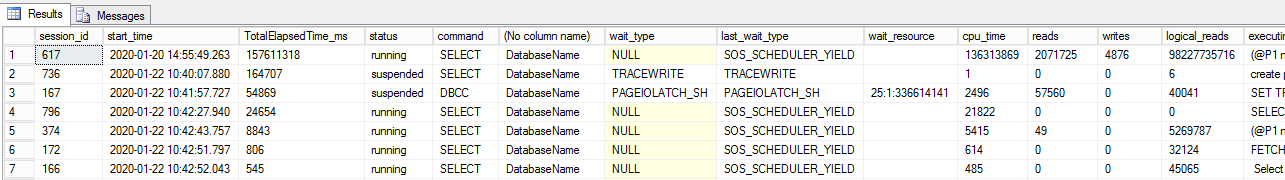
Along with the Top 10 currently most CPU intensive queries, this might be one of my most run troubleshooting queries that are run first. One of the advantages of this is that it will also give you a link to the query plan for quick troubleshooting. Note, however, that some queries that are running do not have a query plan in dm_exec_query_plan and when that is the case, they are excluded from this list. If you are not seeing the results that you expect to see, remove the CROSS APPLY for the query plan view and the query plan from the select.
Query 2: Top 100 Queries with the longest elapsed time run against a specific database
SELECT TOP 100
    qs.total_elapsed_time / qs.execution_count / 1000000.0 AS average_seconds,
    qs.total_elapsed_time / 1000000.0 AS total_seconds,
    qs.execution_count,
    SUBSTRING (qt.text,qs.statement_start_offset/2,
         (CASE WHEN qs.statement_end_offset = -1
            THEN LEN(CONVERT(NVARCHAR(MAX), qt.text)) * 2
          ELSE qs.statement_end_offset END - qs.statement_start_offset)/2) AS individual_query,
    o.name AS object_name,
    DB_NAME(qt.dbid) AS database_name
  FROM sys.dm_exec_query_stats qs
    CROSS APPLY sys.dm_exec_sql_text(qs.sql_handle) as qt
    LEFT OUTER JOIN sys.objects o ON qt.objectid = o.object_id
where qt.dbid = DB_ID()
  ORDER BY average_seconds DESC;
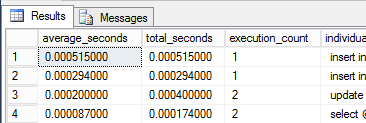
This is a historical view of the top 100 longest running queries in case you long on to the server after the problem ceases to exist.
With these first responder scripts, you should be able to quickly identify the queries that are causing issues and then work on finding more information about what that query is attempting to do.