For each of the posts in the mini-series, we are going to to take a selected topic and focus on the information that gives us a general idea that there is or isn't performance issues that should be looked into further. These checks might not give all of the necessary information to troubleshoot but it should outline if there is an issue that needs investigation.
For CPU performance we will focus on the following Perfmon counters:
- CPU Utilization for individual Cores (% Processor Time *.*)
- CPU Utilization Combined (% Processor Time)
- CPU Privileged Time (% Privileged Time)
- CPU Context Switches (Context Switches/sec)

There is a lot of logic that goes into creating the top-level check. They take each individual check and combine them to give an overall result that is quick and easy to determine. All of the heavy lifting for the logic is done within SQL and SSRS is used to display the results.
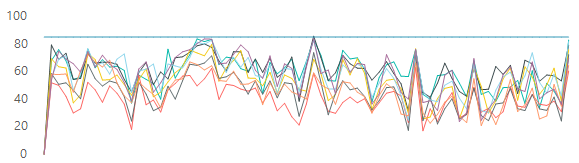
CPU Utilization for Individual Cores:

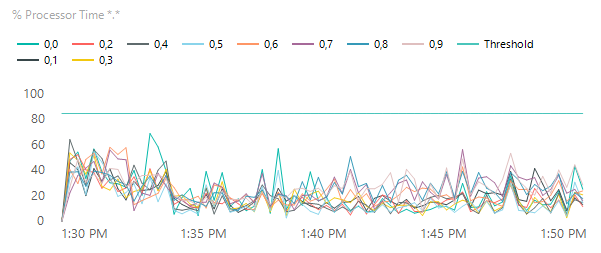
This counter shows the percentage of time that the processor is executing application or operating system processes other than Idle. On the computer that is running SQL Server, this counter should be kept below 85 percent. In case of constant overloading, investigate whether there is abnormal process activity or if the server needs additional CPUs.
There are a few things I check with this counter's data:
- CPU Average Utilization to make sure the CPU usage is not consistently being used above 85% utilization.
- CPU Max Utilization, like average utilization, also checks to make sure that the max utilization data points are not above the threshold line.
To generate the data as displayed above you use the following query against PSSDIAG data that was processed with SQL Nexus or Relog.exe to insert it into a SQL database.
SELECT
    det.CounterName,
    d.CounterValue,
    SUBSTRING(d.CounterDateTime,1,19) AS CounterDateTime,
    det.InstanceName
FROM dbo.CounterData d
    INNER JOIN dbo.CounterDetails det ON d.CounterID = det.CounterID
WHERE countername = '% Processor Time'
    AND det.InstanceName LIKE ('_,_')

UNION ALL

SELECT
    'Threshold',
    85,
    SUBSTRING(d.CounterDateTime,1,19) AS CounterDateTime,
    'Threshold'
FROM dbo.CounterData d
    INNER JOIN dbo.CounterDetails det ON d.CounterID = det.CounterID
WHERE countername = '% Processor Time'
    AND det.InstanceName = ('0,0')
ORDER BY det.CounterName, CounterDateTime
When looking at this graph, you want to see an even utilization across all cores. If you see a few a few cores being heavliy utilized and the others not having the same utilization, there might be an issue with MAX DOP or the number of cores assigned to queries.
Here is an example of the logic assigned to the CPU Max utiliztion check:
SELECT TOP 1 (CounterValue) MinValue
FROM (SELECT TOP 20 PERCENT d.CounterValue
		FROM dbo.CounterData d inner join dbo.CounterDetails det on d.CounterID = det.CounterID
			WHERE countername = '% Processor Time'
			    AND det.InstanceName LIKE ('_,_')
			ORDER BY CounterValue DESC) result
ORDER BY MinValue ASC
I take the minimum value of the top 20 percent of values for the % of processer time and if the minimum is above 90 percent utilized, the check fails and is displayed as a visual.

The next two graphs that are used give an overview to make it easier to see the overall CPU utilization as it is a combined view and CPU Privileged time, which is a view of CPU the amount of CPU usage assigned to processes external to SQL Server.
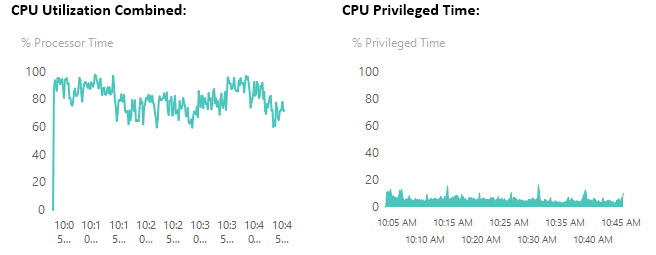
In this example, CPU Utilization overall is higher than the 85% that we would like to see it under. The combined view makes it easy to see overall utilization. The CPU Privileged time demonstrates that the utilization as seen in the previous graph is indeed being used by the SQL Engine service. We are not having issues with another application on the server utilizing too much CPU.
Our final check that we display is CPU Context Switches:
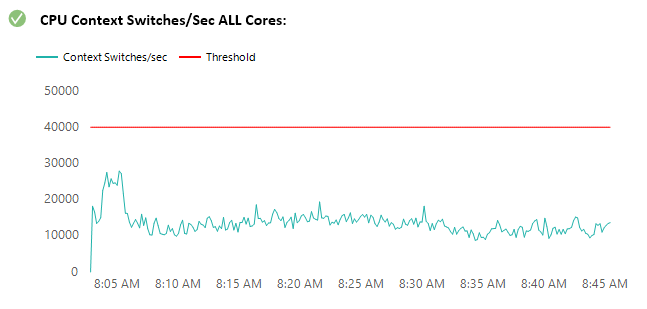
Context Switches/sec is the combined rate at which all processors on the computer are switched from one thread to another. Context switches occur when a running thread voluntarily relinquishes the processor, is pre-empted by a higher priority ready thread, or switches between user-mode and privileged (kernel) mode to use an Executive or subsystem service. If context switches per second are greater than 5000 per second per core, or above the combined total which is indicated by the threshold, it may indicate excessive switching. Here is the logic that is used to display the data in the above example graph:
SELECT
    det.CounterName,
    d.CounterValue,
    SUBSTRING(d.CounterDateTime,1,19) AS CounterDateTime
FROM dbo.CounterData d
    INNER JOIN dbo.CounterDetails det ON d.CounterID = det.CounterID
WHERE countername = 'Context Switches/sec'

UNION ALL

SELECT
    'Threshold',
    (CAST((SELECT TOP 1 [PropertyValue]
            FROM [dbo].[tbl_ServerProperties]
            WHERE PropertyName = 'cpu_count') AS INT) * 5000),
    SUBSTRING(d.CounterDateTime,1,19) AS CounterDateTime
FROM dbo.CounterData d inner join dbo.CounterDetails det on d.CounterID = det.CounterID
WHERE countername = 'Context Switches/sec'
ORDER BY det.CounterName, CounterDateTime
The logic to determine the threshold line is built into the query to place it at 5000 times the number of CPUs assigned.
To get the check on the top-level page for an overall view of CPU Utilization we combine the logic for all CPU related checks into one query. For this query, we chose to leave out the Context Switch check as it was not relevant for our needs, but it can easily be incorporated into the overall check. Here is the query responsible for the CPU Performance check at the beginning of this post:
DECLARE @CPUAVG decimal(18,5);
DECLARE @CPUMaxAvg decimal(18,5);
DECLARE @result1 varchar(2);
DECLARE @result2 varchar(2);
DECLARE @PerfResult varchar(2);

SET @CPUAVG = (select AVG(d.CounterValue)
                from dbo.CounterData d inner join dbo.CounterDetails det on d.CounterID = det.CounterID
                where countername = '% Processor Time'
                and det.InstanceName LIKE ('_,_'))

SET @result1 = (SELECT
	CASE
			WHEN @CPUAVG >= 80
				THEN 2
			WHEN @CPUAVG >= 70
				THEN 1
			ELSE 0
			END AS 'Result' )


SET @CPUMaxAvg = (SELECT TOP 1 (CounterValue) MinValue
                    FROM (SELECT TOP 20 PERCENT d.CounterValue
                            FROM dbo.CounterData d inner join dbo.CounterDetails det on d.CounterID = det.CounterID
                                where countername = '% Processor Time'
                                and det.InstanceName LIKE ('_,_')
                                order by CounterValue DESC) result
                    ORDER BY MinValue ASC)

SET @result2 = (SELECT
	CASE
			WHEN @CPUMaxAvg >= 90
				THEN 2
			WHEN @CPUMaxAvg >= 75
				THEN 1
			ELSE 0
			END AS 'Result' )

SET @PerfResult = (Select
	CASE
		WHEN @result1 >= @result2
			THEN @result1
		ELSE @result2
	END as Result)

SELECT @PerfResult
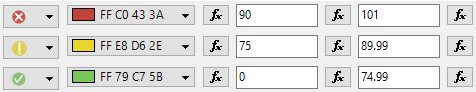
If the returned value is equal to 2 then the check fails, if it equals 1 then it presents a warning, if it returns 0, then the check passes.
With this information we are able to quickly determine if there are utilization issues with the CPU and we need to investigate to see if it is a resource issue or if we can take a look at optimizing the queries that being sent to the server any maybe offload some of the processing to another server if it is not possible to optimize.