There are quite a few counters that we are going to look at when it comes to determining if there are issues reading or writing to disks hosting the databases files. In this post I will cover the following perfmon counters:
- Disk Latency - Reading (Avg Disk Sec/Read ms)
- Disk Latency - Writing (Avg Disk Sec/Write ms)
- Disk Throughput (Disk MegaBytes/sec)
- Disk IOPS - Reading (Disk Reads/Sec)
- Disk IOPS - Writing (Disk Writes/Sec)
- Disk Queue Length (Current Disk Queue Length)

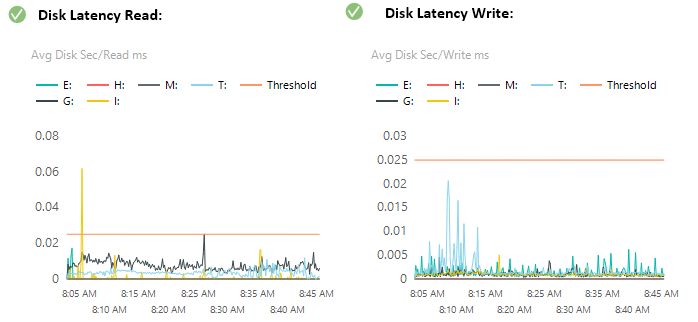
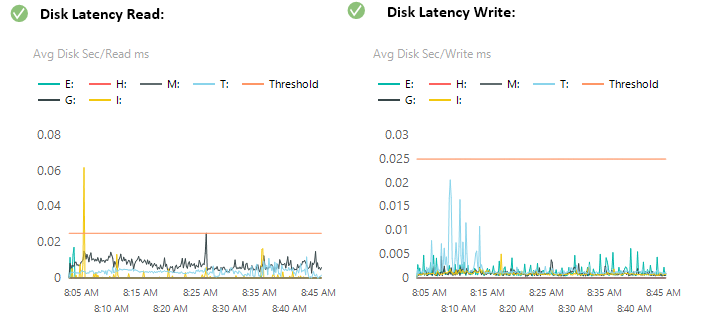
Disk Latency is the time it takes for the disk to respond to a read or write command. This counter measures the time in milliseconds of the average disk read or write. A high value for this counter is cause for concern even if the queue counters do not indicate an issue. Generally, the value needs to be less than 15 ms or 0.015 on this chart. In the following graphs, the threshold is set to 25 ms for our environment but I would argue that it should be no more than 15 ms. Here is the query that is used to generate the Disk Latency graphs:
SELECT
    det.CounterName,
    d.CounterValue,
    SUBSTRING(d.CounterDateTime,1,19) AS CounterDateTime,
    det.ObjectName,
    det.InstanceName
FROM dbo.CounterData d
    INNER JOIN dbo.CounterDetails det ON d.CounterID = det.CounterID
WHERE countername = 'Avg. Disk sec/Read'
    AND det.ObjectName = 'LogicalDisk'
    AND det.InstanceName LIKE '_:'
    AND det.InstanceName NOT LIKE 'C:'

UNION ALL

SELECT 'Threshold',
    0.015,
    SUBSTRING(d.CounterDateTime,1,19) AS CounterDateTime,
    'Threshold',
    'Threshold'
FROM dbo.CounterData d
    INNER JOIN dbo.CounterDetails det ON d.CounterID = det.CounterID
WHERE countername = 'Avg. Disk sec/Transfer'
    AND det.ObjectName = 'LogicalDisk'
    AND det.InstanceName = 'C:'
ORDER BY det.CounterName,det.instancename, CounterDateTime
In the above query you are able to exclude any volume that you do not consider to be database volumes. When can see the output in the following SSRS graph:
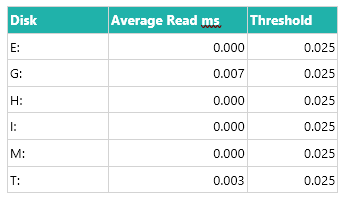
I also create a table with the overall average read and write response time for the duration of the data collection for each disk with the columns changing colour based on if they exceed the threshold. Table Example:
Here is the query that was used when generating the table:
;with cte as (
SELECT CounterValue
		,det.CounterName
		,det.ObjectName
		,det.InstanceName
		,PERCENT_RANK() OVER (PARTITION BY det.InstanceName ORDER BY CounterValue ) AS PctRank
	FROM dbo.CounterData d inner join dbo.CounterDetails det on d.CounterID = det.CounterID
	WHERE countername = 'Avg. Disk sec/Read'
	AND det.ObjectName = 'LogicalDisk'
	AND det.InstanceName LIKE '_:'
	AND det.InstanceName NOT LIKE 'C:'
)
SELECT CONVERT(DECIMAL(16,3)
    ,AVG(CounterValue)) AS CounterValue
	,CounterName
	,ObjectName
	,InstanceName
	FROM cte
	WHERE PctRank <= '.9'
	GROUP BY CounterName,ObjectName,InstanceName
When getting the average disk read and write there will be erroneous data in the values when a read or write is being initiated. We utilize PERCENT_RANK in this query and then select the average of the top 90% of the response time in order to eliminate some of the response time skips that occur during normal operation. If a disk has a consistent top response time above 0.015, it is flagged as an issue that needs to be addressed. Modern day storage systems in servers should be able to keep this value at 0.005 ms and lower and higher than 0.0015 indicates a busy storage system.
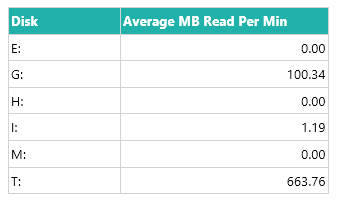
Disk throughput is a measurement of the average number of megabytes transferred within a period of one second for a specific file size. Each storage medium has an upper limit for how much data it can handle, so a constant max value might indicate that the throughput upper limit threshold has been reached. I do not flag any thresholds on this graph because each storage system will be different. It will be up to the DBA to determine if the numbers displayed on this graphs are problematic.
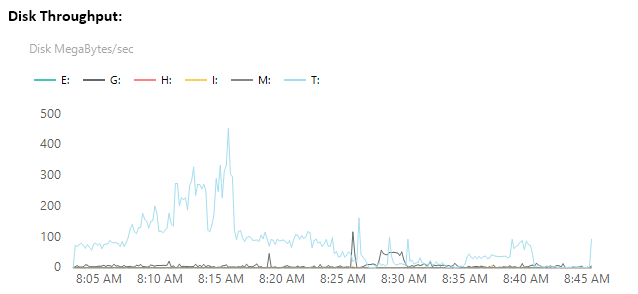
This graph is also accompanied with a table to be able to better interpret the data as seen here:
Here are the queries that are used to generate both the table and the graph above:
-- GRAPH:
SELECT det.CounterName
	,d.CounterValue / 1024.0 / 1024.0 AS 'Disk MegaBytes/Sec'
	,SUBSTRING(d.CounterDateTime,1,19) AS CounterDateTime
    ,det.ObjectName
	,det.InstanceName
FROM dbo.CounterData d INNER JOIN dbo.CounterDetails det on d.CounterID = det.CounterID
WHERE countername = 'Disk Bytes/sec'
    AND det.ObjectName = 'LogicalDisk'
    AND det.InstanceName LIKE '_:'
    AND det.InstanceName NOT LIKE 'C:'
-- TABLE:
SELECT det.CounterName
	,SUM(d.CounterValue / 1024.0 / 1024.0 * 10) / (SELECT DATEDIFF(MINUTE,SUBSTRING(MIN(CounterDateTime),1,19),SUBSTRING(MAX(CounterDateTime),1,19)) FROM dbo.CounterData) AS AvgMBReadPerMin
	,det.InstanceName
FROM dbo.CounterData d INNER JOIN dbo.CounterDetails det on d.CounterID = det.CounterID
WHERE countername = 'Disk Read Bytes/sec'
	AND det.ObjectName = 'LogicalDisk'
	AND det.InstanceName LIKE '_:'
	AND det.InstanceName NOT LIKE 'C:'
GROUP BY det.CounterName,det.InstanceName
This information can also be used to see if there might be excessive writing to the log or database files if it is unexpected.
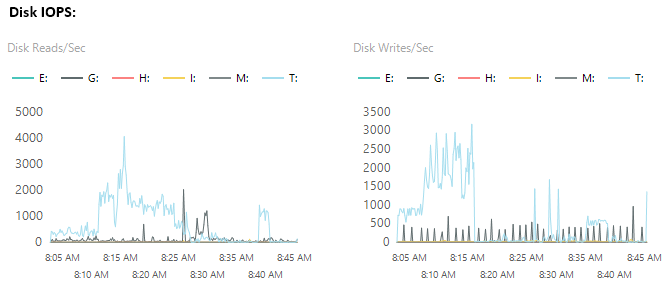
Disk IOPS counter captures the total number of individual disk IO requests completed over a period of one second. This is an indication of how busy the disks are on the virtual host. Each storage medium has an upper limit for how many IOPS it can handle, so a constant max value might indicate that the IOPS upper limit threshold has been reached.
To give an example of IPOS per storage medium, a traditional spinning HDD will have an IOPS range within 50 to 250 range. Modern day SSD drives have an IOPS range of 5,000 to 50,000. High end storage applicances can easily break the 100K IOPS mark. Lower IPOS numbers in the perfmon data does not indicate a problem by itself. I would only use these numbers in conjunction with other values that indicate that the server is not able to read/write data in a timely manor.
Here is an example of IOPS graphs within an SSRS report and a query example used to pull out the data:
SELECT det.CounterName
    ,d.CounterValue
    ,SUBSTRING(d.CounterDateTime,1,19) AS CounterDateTime
    ,det.ObjectName
    ,det.InstanceName
FROM dbo.CounterData d INNER JOIN dbo.CounterDetails det on d.CounterID = det.CounterID
WHERE countername = 'Disk Reads/sec'
    AND det.ObjectName = 'LogicalDisk'
    AND det.InstanceName LIKE '_:'
    AND det.InstanceName NOT LIKE 'C:'
Current Disk Queue Length is a direct measurement of the disk queue present at the time of the sampling. This is a measurement of the data waiting to be written to the disk. Any value above 2 for an extended period is an indication of the disk not being able to keep up with the workload required.
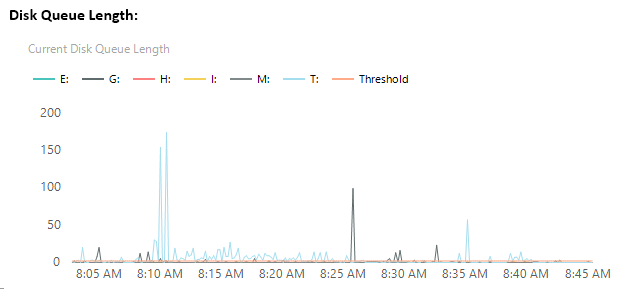
Spikes are typical when looking at this graph but values that are consistently above the threshold might be indicative of an issue with storage not able to keep up with throughput demands.
Here is the query used to generate the Disk Queue Length:
SELECT det.CounterName
	,d.CounterValue
	,SUBSTRING(d.CounterDateTime,1,19) AS CounterDateTime
    ,det.ObjectName
	,det.InstanceName
FROM dbo.CounterData d
    INNER JOIN dbo.CounterDetails det on d.CounterID = det.CounterID
WHERE countername = 'Current Disk Queue Length'
    AND det.ObjectName = 'LogicalDisk'
    AND det.InstanceName LIKE '_:'
    AND det.InstanceName NOT LIKE 'C:'


UNION ALL

SELECT 'Threshold'
    ,2
    ,SUBSTRING(d.CounterDateTime,1,19) AS CounterDateTime
    ,'Threshold'
    ,'Threshold'
FROM dbo.CounterData d
    INNER JOIN dbo.CounterDetails det on d.CounterID = det.CounterID
WHERE countername = 'Avg. Disk sec/Transfer'
    AND det.ObjectName = 'LogicalDisk'
    AND det.InstanceName = 'C:'
order by det.CounterName,det.instancename, CounterDateTime
To produce the Disk Performance Check on the main page of the report, I used a SQL query that checks both read and writing latency and reports if those values are above the 0.015 threshold. Here is the query attached to the SSRS Gauge:
DECLARE @DriveIO decimal(18,5);
DECLARE @DriveIOWrite decimal(18,5);
DECLARE @result1 varchar(2);
DECLARE @result2 varchar(2);
DECLARE @PerfResult varchar(2);

;with cte as (
                SELECT CounterValue
                        ,det.CounterName
                        ,det.ObjectName
                        ,det.InstanceName
                        ,PERCENT_RANK() OVER (PARTITION BY det.InstanceName ORDER BY CounterValue ) AS PctRank
                    FROM dbo.CounterData d inner join dbo.CounterDetails det on d.CounterID = det.CounterID
                    where countername = 'Avg. Disk sec/Read'
                    and det.ObjectName = 'LogicalDisk'
                    and det.InstanceName LIKE '_:'
                    and det.InstanceName NOT LIKE 'C:'
                    and det.InstanceName NOT LIKE 'D:'
                    and det.InstanceName NOT LIKE 'F:'
                )
                SELECT @DriveIO = AVG(CounterValue)
                FROM (Select TOP 10 CounterValue
                    FROM cte
                    WHERE PctRank <= '.9'
                    ORDER BY CounterValue DESC) AS Result

SET @result1 = (SELECT
	CASE
			WHEN @DriveIO >= 0.015
				THEN 2
			WHEN @DriveIO >= 0.0075
				THEN 1
			ELSE 0
			END AS 'Result' )

;with cte as (
                SELECT CounterValue
                        ,det.CounterName
                        ,det.ObjectName
                        ,det.InstanceName
                        ,PERCENT_RANK() OVER (PARTITION BY det.InstanceName ORDER BY CounterValue ) AS PctRank
                    FROM dbo.CounterData d inner join dbo.CounterDetails det on d.CounterID = det.CounterID
                    where countername = 'Avg. Disk sec/Write'
                    and det.ObjectName = 'LogicalDisk'
                    and det.InstanceName LIKE '_:'
                    and det.InstanceName NOT LIKE 'C:'
                    and det.InstanceName NOT LIKE 'D:'
                    and det.InstanceName NOT LIKE 'F:'
                )
                SELECT @DriveIOWrite = AVG(CounterValue)
                FROM (Select TOP 10 CounterValue
                    FROM cte
                    WHERE PctRank <= '.9'
                    ORDER BY CounterValue DESC) AS Result

SET @result2 = (SELECT
	CASE
			WHEN @DriveIOWrite >= 0.015
				THEN 2
			WHEN @DriveIOWrite >= 0.0075
				THEN 1
			ELSE 0
			END AS 'Result' )

SET @PerfResult = (Select
	CASE
		WHEN @result1 >= @result2
			THEN @result1
		ELSE @result2
	END as Result)

SELECT @PerfResult
A result of 2 indicates that there is an issue, 1 indicates that there is a warning and 0 if the drive latency is under the acceptable limit.
When used in conjunction, this collection of performance counters should be accurately tell you if there is an issues with disk performance when data collection is setup to run when the issue is present on the server.