One of the tasks of the database team is to continually improve process and automate what can be automated. My manger recently approached me with a request to see if there is some way we would be able to generate a report that would assist a DBA in problem investigations when it come to performance issue.
Our DBA responsibilities at this organization might differ from the role at a DBA at another organization. We are strictly in charge of the database infrastructure. We make sure the database is online an connections are able to occur and there is nothing, infrastructure wise, that is preventing the database from running optimally. This means, there are quantifiable numbers that we are able to check to make sure that the server falls within best practices that do not include things like, index performance, poorly written queries. If we can automate the quantifiable numbers, that will free up time to delve deeper into performance issues faster and possibly point out issues with infrastructure immediately.
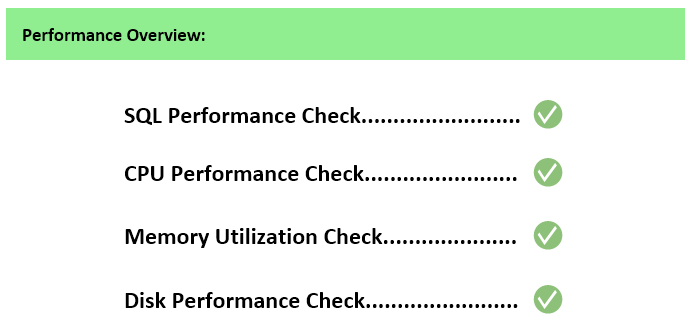
In this mini-series we will be going over the four areas and talk about the counters and checks that will be used to generate a performance report:

At the end of the mini-series, I will be sharing some code that is used to generate a performance report in SQL Server Reporting Services that may be able to assist in some performance issue troubleshooting.
To generate the performance report with logic, we use the data collection tool PSSDAIG on an SQL Instance with it configured to only collect perfmon data. There will be a blog post on generating a performance report which will cover what is collected and how it is collected. All counters in the mini-series posts will refer to a perfmon counter that is availible on a SQL Server and included in the data collection.
