
The goal of the Mini-Series was to explorer the different performance monitors that correspond to quickly identifying if there is a potential issue with the underlying server infrastructure. Taking all of the performance counters mention in the previous posts, we are now ready to begin building out the SSRS report to tie everything together.
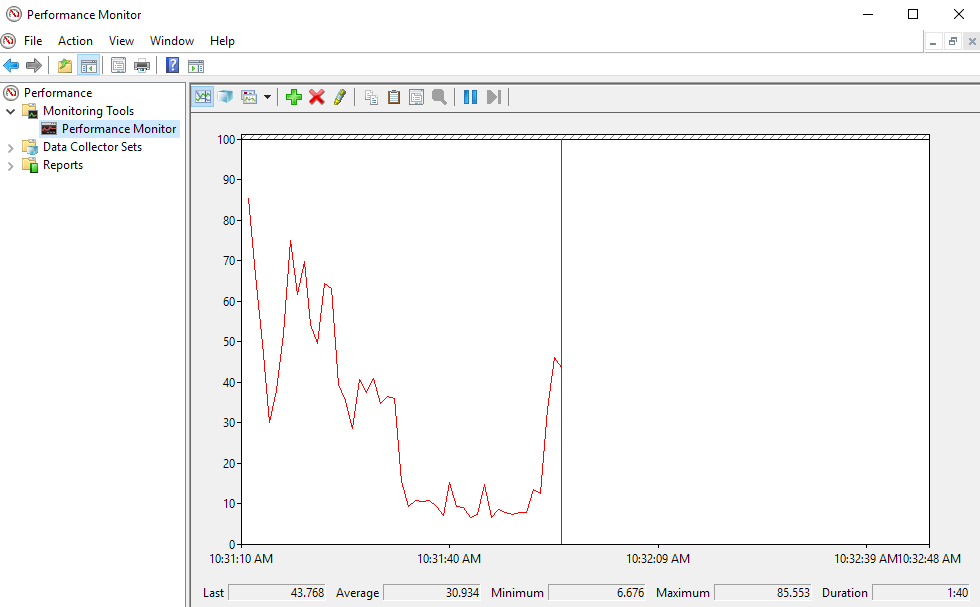
To start, we need data to report against. All of the counters used will be performance counters and there are various methods to be able to collect them. Performance Monitor can be used to capture and save the output into a BLG file.
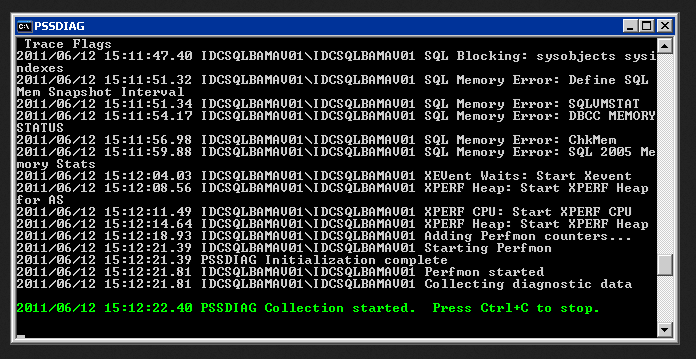
You are able to use the Microsoft troubleshooting tool refereed to as PSSDIAG. You can download it here:
https://support.microsoft.com/en-us/help/830232/pssdiag-data-collection-utility
I use a modified version of the PSSDIAG tool for data collection that is setup to only collect performance counters. I created a powershell wrapper that fills out the required information in PSSDIAG and launches it. I will included a copy of a sample ini file at the end of this post that I use for data collection.
Now that you have the data collected, you need to process it and insert it into a SQL Database for reporting purposes. If you have a blg file created with performance monitor, you can convert that into data using a tool called relog.exe. Relog.exe is included already with windows, so no installation necessary. Here is the Microsoft commands article on relog.exe:
The recommended method of processing the data is a Microsoft Troubleshooting tool call SQL Nexus. This method can only be used if PSSDIAG was used for data collection. Not only does it pull out perfmon data and process it, it also adds in other details from the SQL Server that I use in other parts of the report.
SQL Nexus can be downloaded here:

When processing the data with SQL Nexus, it leverages relog.exe to process the perfmon counter data. When SQL Nexus processes the perfmon.blg file, it appears to only import 50% of the data points. I assume this is to save space and still give you an accurate picture of the readings from the environment. In some cases, this did not work out well for us, so after SQL Nexus finished processing the file, I truncated the tables and re-processed the data using relog.exe and ended up with no values skipped. SQL Nexus can be called though command line arguments to that it processes the data and uploads it to a named database instead of the default "SQLNexus" database that is selected if you use the GUI. I wrote a PowerShell wrapper that processes the zipped PSSDIAG file with SQL Nexus and then relogs the data and then launches a SSRS report against the data that was just processed.
The SSRS report can be built using the information provided in the mini-series but I will be working on packaging the report file in a downloadable Visual Studio project that will make deployment easier in your environment. I have added some additional information in the report that gets included in the database once it is processed with SQL Nexus.
Here is the example of some of the working file responsible for data collection and processing:
PSSDIAG.ps1 is responsible to launching PSSDIAG.cmd and inserting values into the xml that controls what gets logged by PSSDIAG.

PSSDIAG uses an xml file to determine what type of information gets logged by the tool. There is a tool that quickly helps generate xml files called DiagManager. You are able to download the tool here:
Here is an example pssdiag.xml file that we use:
Finally, here is the PowerShell that is use to generate reports using the zip file created in the PSSDIAG.ps1 PowerShell.
Here is the Powershell that unpacks the zip file, launches SQL Nexus to process the data, re-processed the data using relog.exe and then connects to SSRS to generate a report file in a Word Document Format.
Once the report files have been packaged and uploaded you should be able to modify it and make it relevant for on-demand performance analysis. It should be able to quickly pin-point areas that need further investigation.