There are lots of different measurements when it comes to SQL Performance but for the purposes of the SQL Performance report being built out, I will be concentrating on 3 perfmon counters:
- Batch Requests/Sec
- Page Life Expectancy
- Lazy Writer

These counters, when used with the other checks covered by the previous blog posts, will be able to let us know if there are any issues with the underlying infrastructure that need to be looked into further. If everything looks good then the next step is to start checking out query performance and optimization.
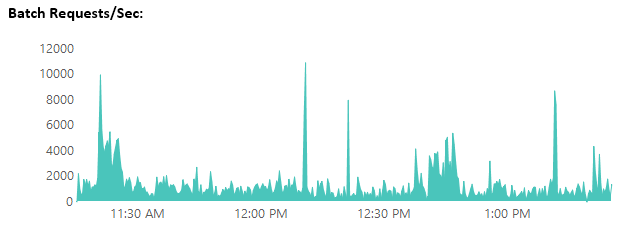
Batch Requests/Sec are the number of Transact-SQL command batches received per second. This statistic is affected by all constraints (such as I/O, number of users, cache size, complexity of requests, and so on). High batch requests mean good throughput. Batch requests can be used as a good baseline to reflect server workload. (500 = Busy, 1000 = Watch CPU Capacity)
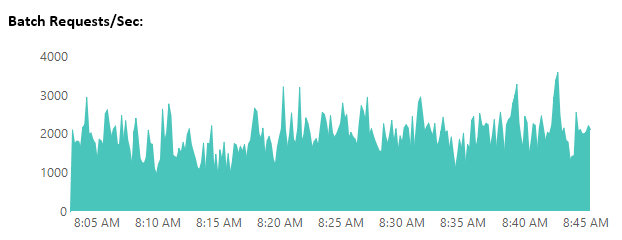
There is no measurement with this counter that will automatically flag an issue, but it is used to quickly determine how busy the SQL Server is and how that might affect the other areas of performance (CPU, Memory and Disk). The higher this number, the greater the demands will be for all resources on the server.
Page Life Expectancy is the number of seconds a page will stay in the buffer pool without references. If this value gets below 300 seconds, this is an indication that SQL Server is doing too many logical reads putting pressure on the buffer pool or potentially that your SQL Server could use more memory to boost performance. Anything below 300 is a critical level. Some would argue that the 300 number is an older number and that number should now be closer to 1000 with the greater availability of ram on servers now. Any number below 1000 should be investigated as potential memory pressure issues.
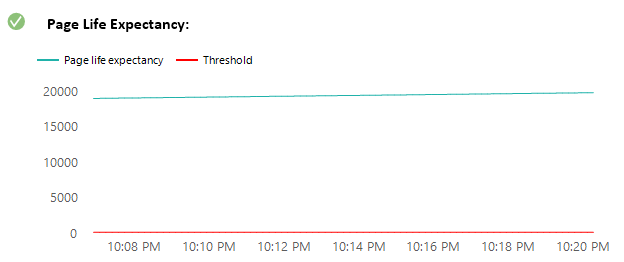
Here is the query used to create the Page Life Expectancy graph with threshold line:
SELECT det.CounterName
    ,d.CounterValue
    ,SUBSTRING(d.CounterDateTime,1,19) AS CounterDateTime
FROM dbo.CounterData d
    INNER JOIN dbo.CounterDetails det on d.CounterID = det.CounterID
WHERE det.countername = 'Page life expectancy'
    AND det.ObjectName LIKE '%:Buffer Node'
    AND det.InstanceName = '000'

UNION ALL

SELECT 'Threshold'
    ,500
    ,SUBSTRING(d.CounterDateTime,1,19) AS CounterDateTime
FROM dbo.CounterData d
    INNER JOIN dbo.CounterDetails det on d.CounterID = det.CounterID
WHERE det.countername = 'Page life expectancy'
    AND det.ObjectName LIKE '%:Buffer Node'
ORDER BY det.CounterName, CounterDateTime
The Lazy Writer counter tracks how many times a second that the Lazy Writer process is moving dirty pages from the buffer to disk to free up buffer space. A generally accepted value of LESS than 20 per second is acceptable; however, it should be close to zero.
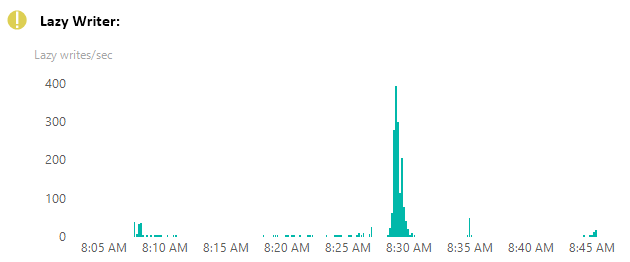
If your Page Life Expectancy is low and you can see that the Lazy Writer is being activated to write pages to disk, you can tell that the SQL Server is having memory pressure issues and is forced to excessively make writes to disk. This in turn creates more IO on the disks and you should be able to see more usage than typical. For SQL to work optimally, the higher the lifetime pages are able to be kept in memory, the less work the server will have to put on the drives to move data into memory and to write data when it gets forced out.
Here is the query used to generate the SSRS gauge that is shown above:
SELECT det.CounterName
    ,d.CounterValue
    ,SUBSTRING(d.CounterDateTime,1,19) AS CounterDateTime
FROM dbo.CounterData d INNER JOIN dbo.CounterDetails det on d.CounterID = det.CounterID
WHERE countername = 'Lazy writes/sec'
ORDER BY det.CounterName, CounterDateTime
The guage is setup to check the max value returned to see if it is beyond a threshold.
The SQL Performance Check on the main page is a combination of Page Life Expectancy and Lazy Writer checks. Here is the query used to generate the results for the main page gauge:
DECLARE @result1 varchar(2);
DECLARE @result2 varchar(2);

SET @result1 = (SELECT TOP 1
		CASE
			WHEN d.CounterValue <= 200
				THEN 0
			WHEN d.CounterValue < 450
				THEN 1
			ELSE 2
		END as 'CounterValue'
	from dbo.CounterData d inner join dbo.CounterDetails det on d.CounterID = det.CounterID
	where countername = 'Lazy writes/sec'
	ORDER BY 'CounterValue' desc)
SET @result2 = (SELECT TOP 1
		CASE
			WHEN d.CounterValue > 1500
				THEN 0
			WHEN d.CounterValue > 500
				THEN 1
			ELSE 2
		END as 'CounterValue'
	from dbo.CounterData d inner join dbo.CounterDetails det on d.CounterID = det.CounterID
	where countername = 'Page life expectancy'
	and det.ObjectName LIKE '%:Buffer Node'
	and det.InstanceName = '000'
	ORDER BY 'CounterValue' desc)
Select
	CASE
		WHEN @result1 >= @result2
			THEN @result1
		ELSE @result2
END AS Result
A result of 2 is failed, 2 is a warning and 0 is a passed check.
This is the last of the infrastructure checks before we merge it all together to generate a performance report. The next blog entry will cover the basic's of building out an SSRS report and the methods that can be used for data collection.